


Measures of Central Tendency
Some different measures of central tendency
- Measures of central tendency is a fancy way of saying...:
- Mean: Add up all your results and divide by the number od bits of data
- Mode: Most common data point
- Median: The middle most point when data is ordered
Fancy way of writing mean
\(\overline{x}\) is a fancy way of writing the mean (xbar)
Calculating medians
- For medians in listed data, find \(\frac{n}{2}\)
- If it's a decimal, round up
- If it's a whole number, use the number halfway between this item and the one after.
- For grouped data. you add up everything and divide by 2.
- E.G. Grouped data frequency total = 17, so we divide by 2 to get the position to use as 8.5
- This is the same as for listed data (\(\frac{n}{2}\)) but we then use linear interpolation.
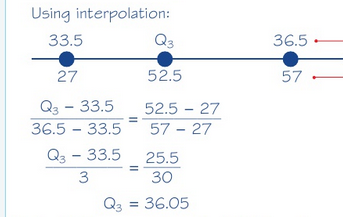
More complicated medians for grouped data
- If we assume the 7th person has an iq of 90 (upper bound)
- If we assume the 12th person has an iq of 100 (upper bound)
- This means that we can use ratios to work out the medians
- We know we are looking for the 8.5th piece of data
- The denominator in our equation is the difference between the two bounds (12-7=5) (100-90=10)
- \(\frac{x-90}{10}=\frac{8.5-7}{5}\)
- \(x-90=3\)
- \(x=93\)
- This is our median estimate and this process is called linear interpolation.
Linear Interpolation equation
- \(\frac{median - \text{Lower data bound}}{\text{upper data bound - lower data bound}}=\frac{\text{median position}-\text{lower frequency bound}}{\text{upper frequency bound}-\text{lower frequency bound}}\)
Weight of cat
- Median class interval is in the \(3\leq w<4\) range
- \(\frac{w-3}{1}=\frac{16-10}{18}\)
- \(w-3=\frac{6}{18}\)
- \(w=3 \frac{1}{3}\)
Time (in seconds)
- Median class interval is in the \(12\leq t<14\) range
- \(\frac{t-12}{2}=\frac{10-7}{13}\)
- \(\frac{t-12}{2}=\frac{3}{13}\)
- \(t-12=\frac{6}{13}\)
- \(t=12 \frac{6}{13}\)