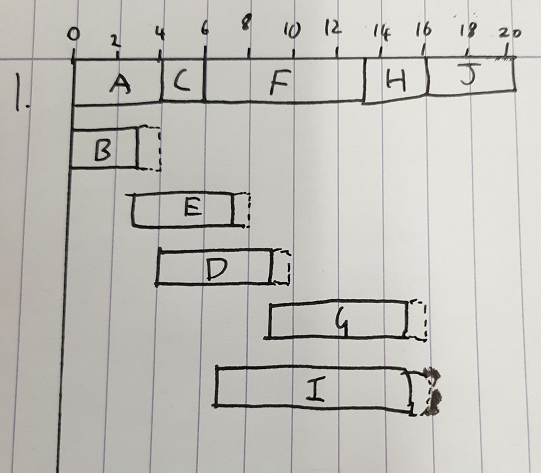
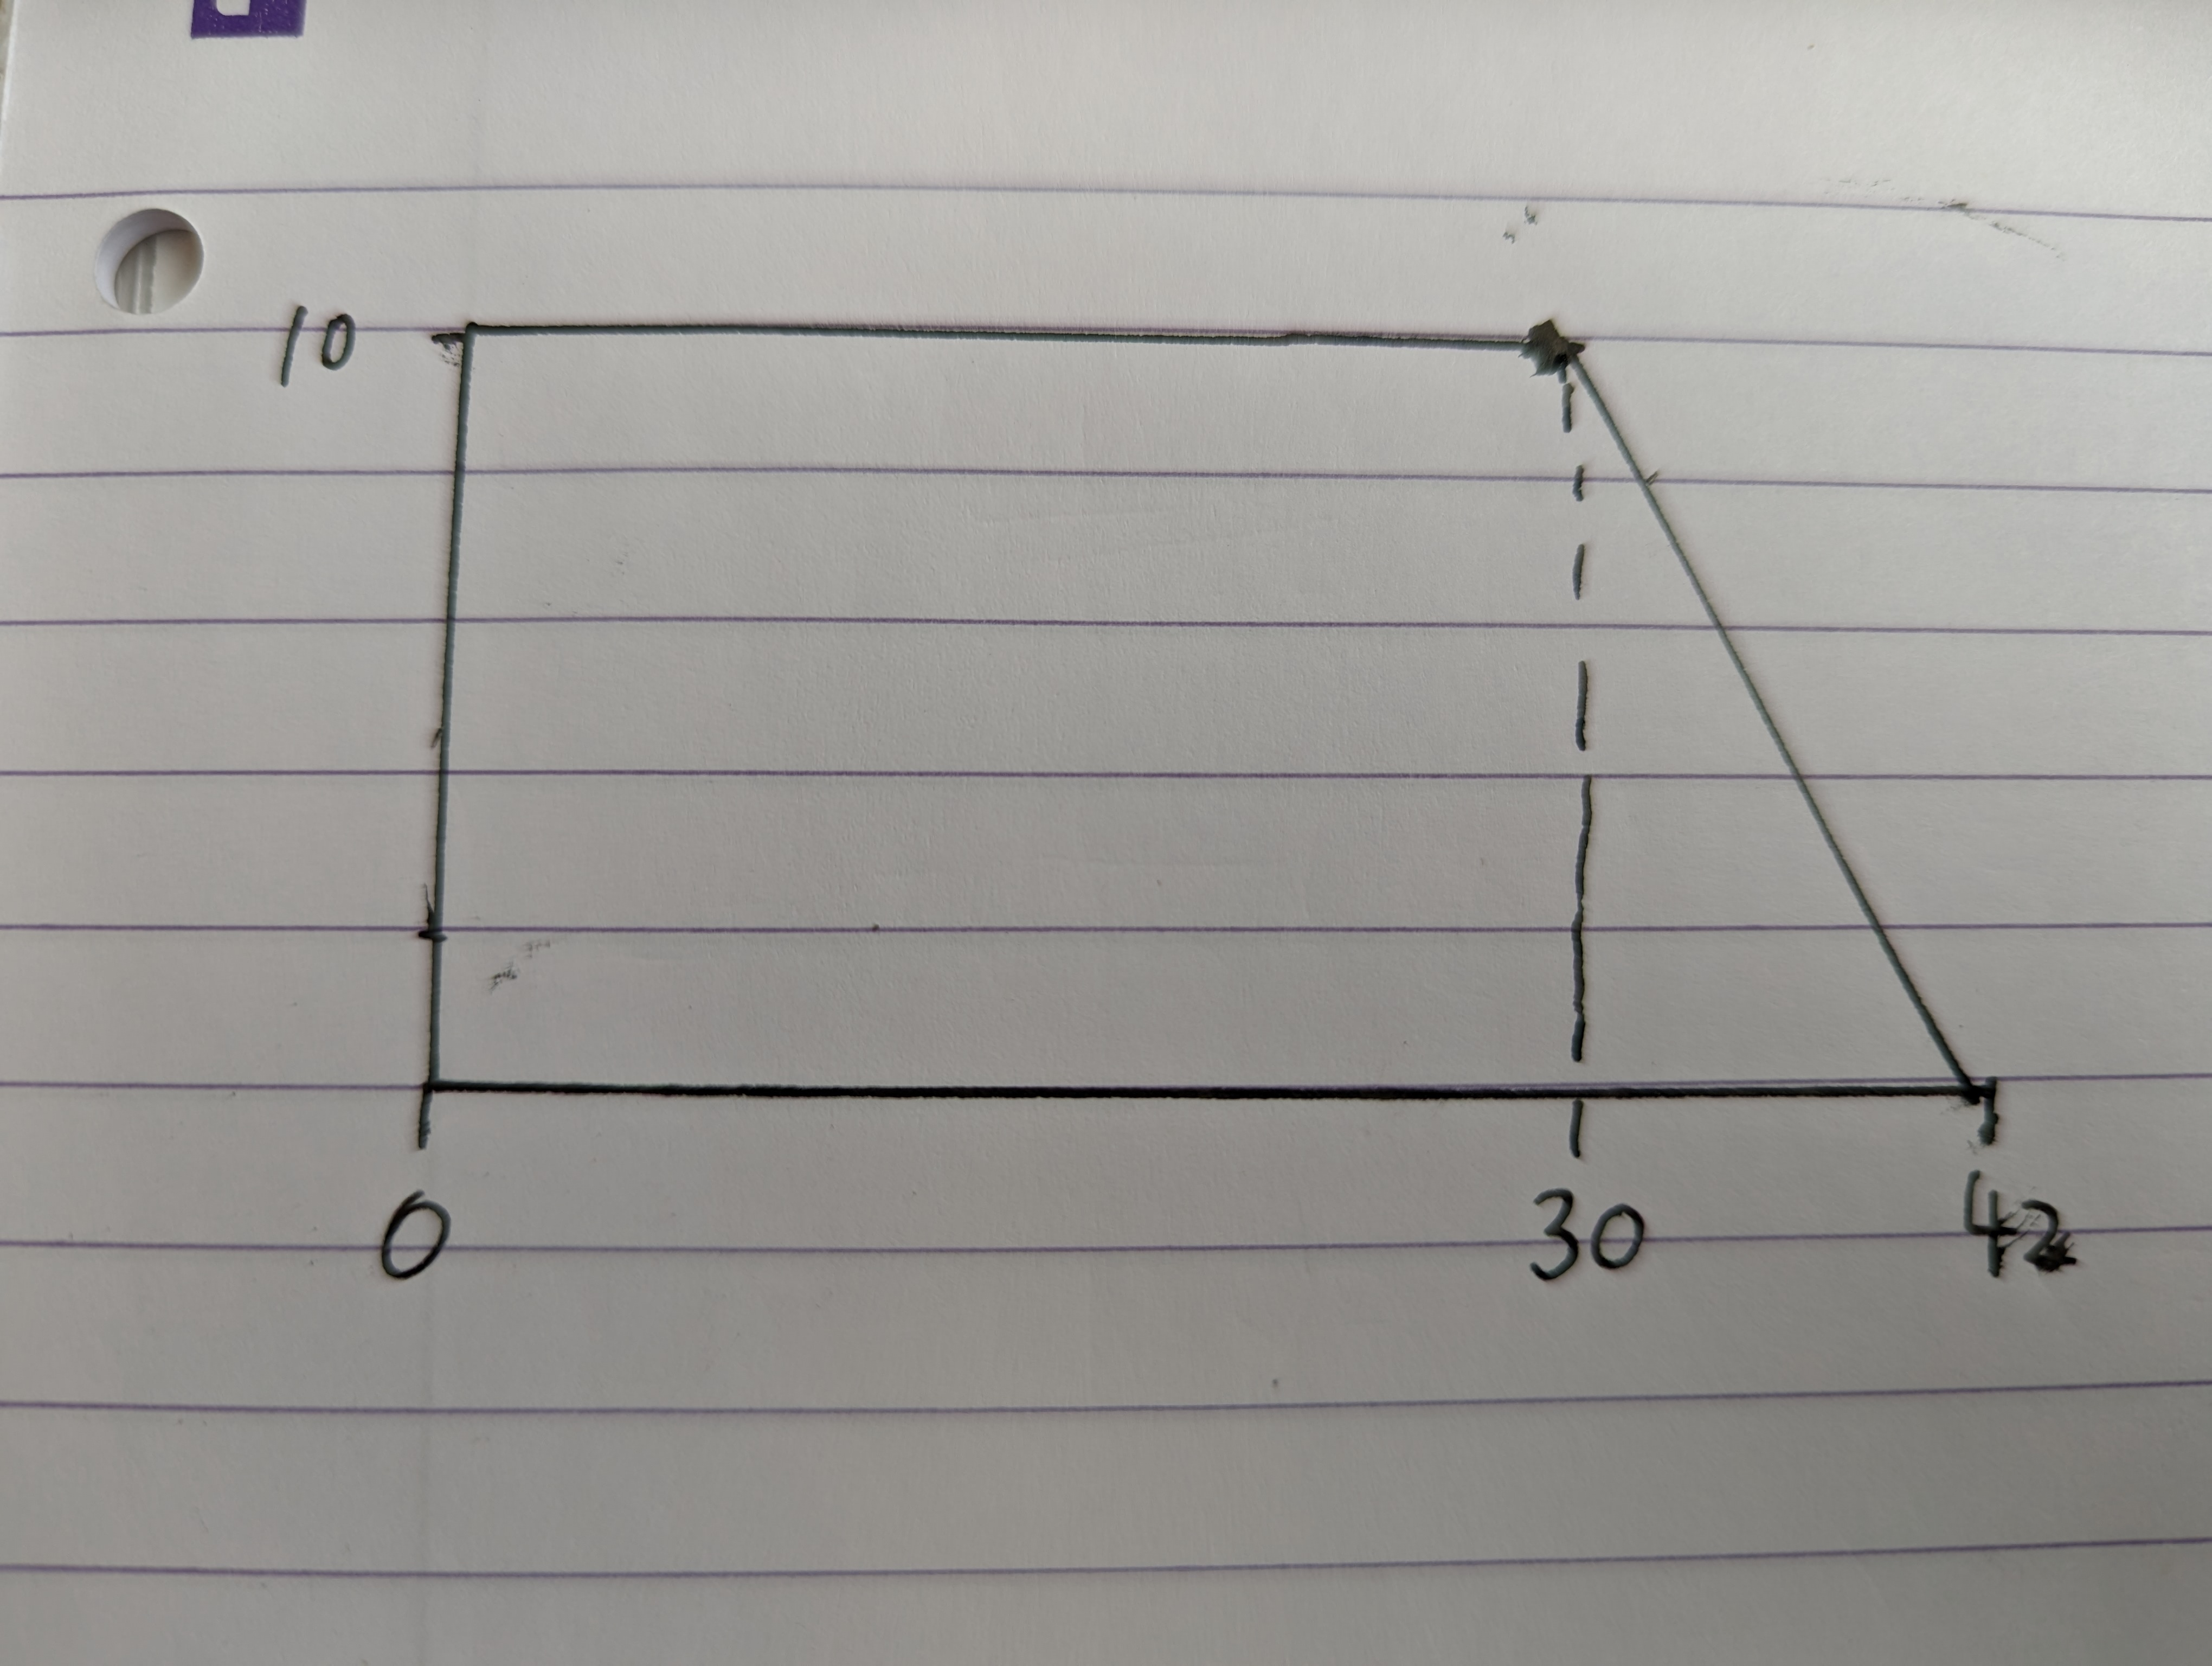
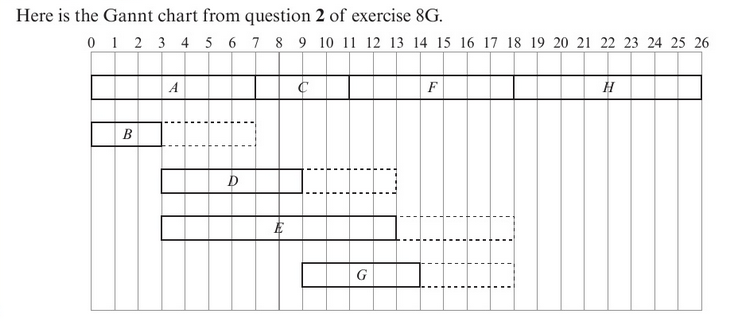
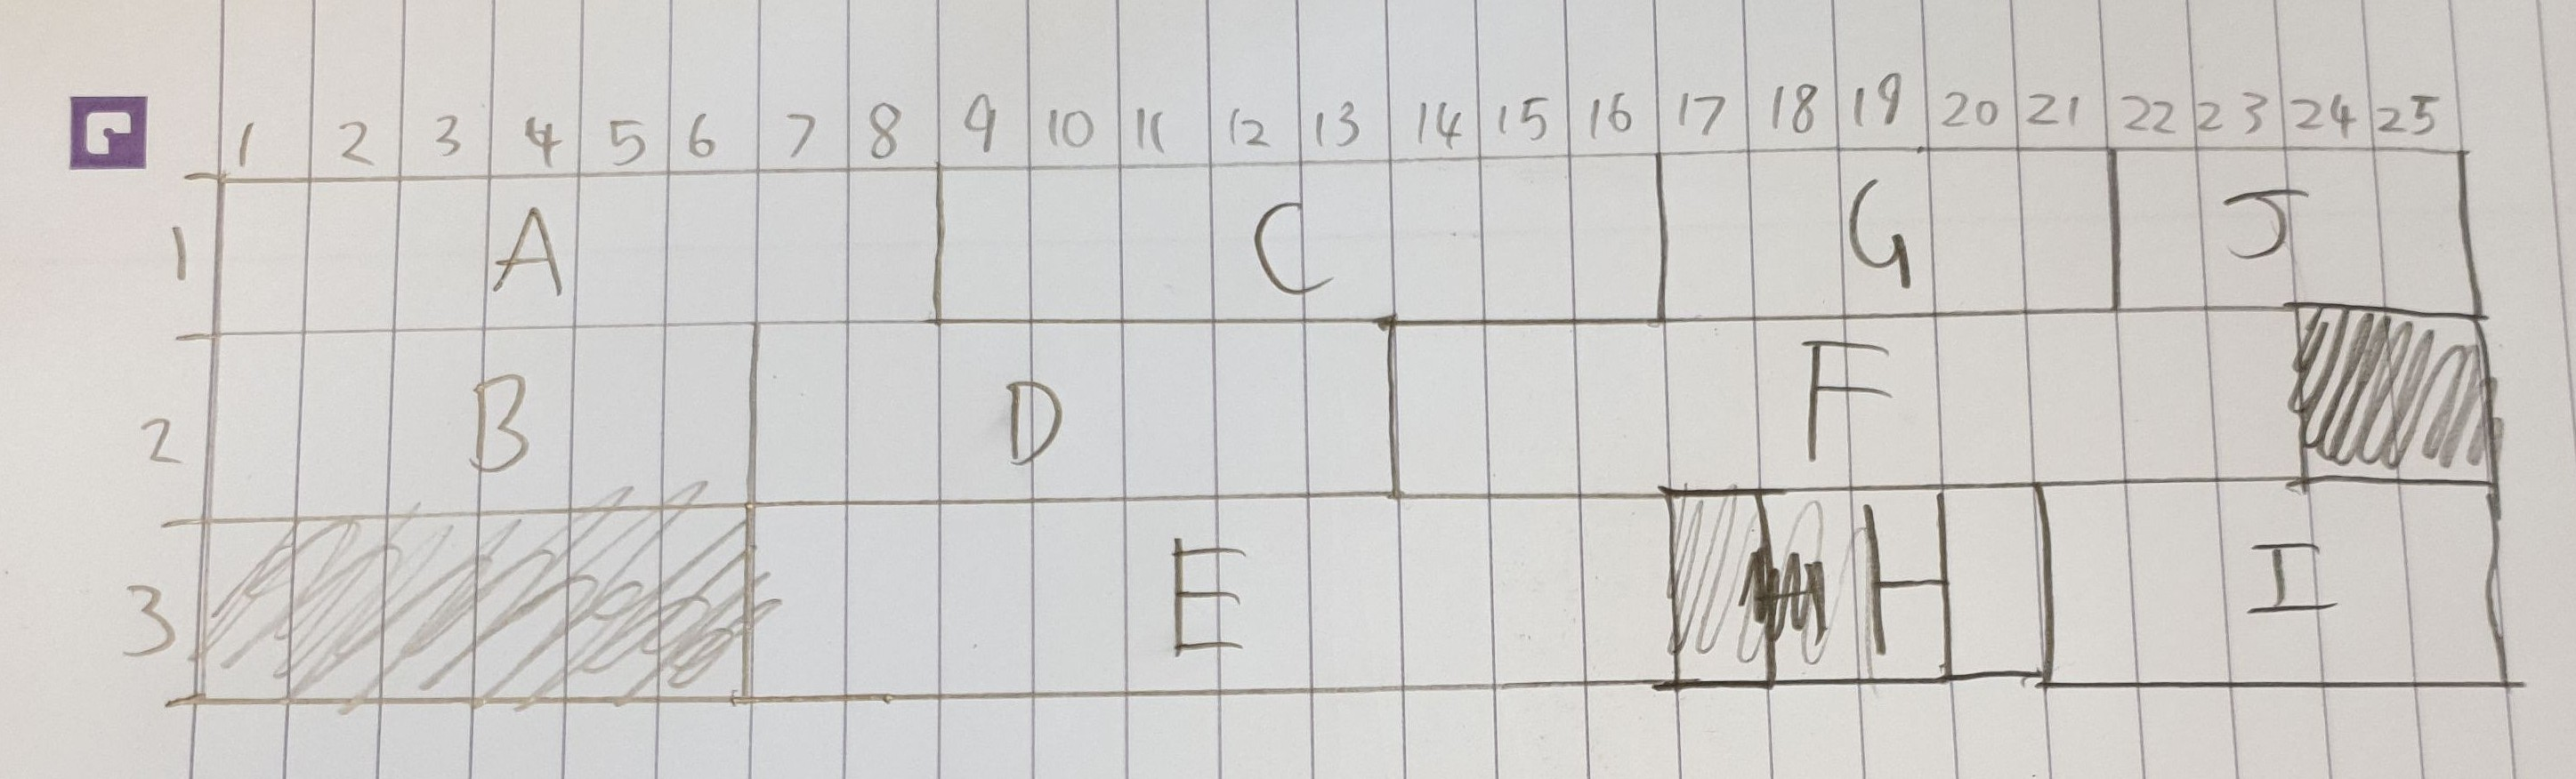
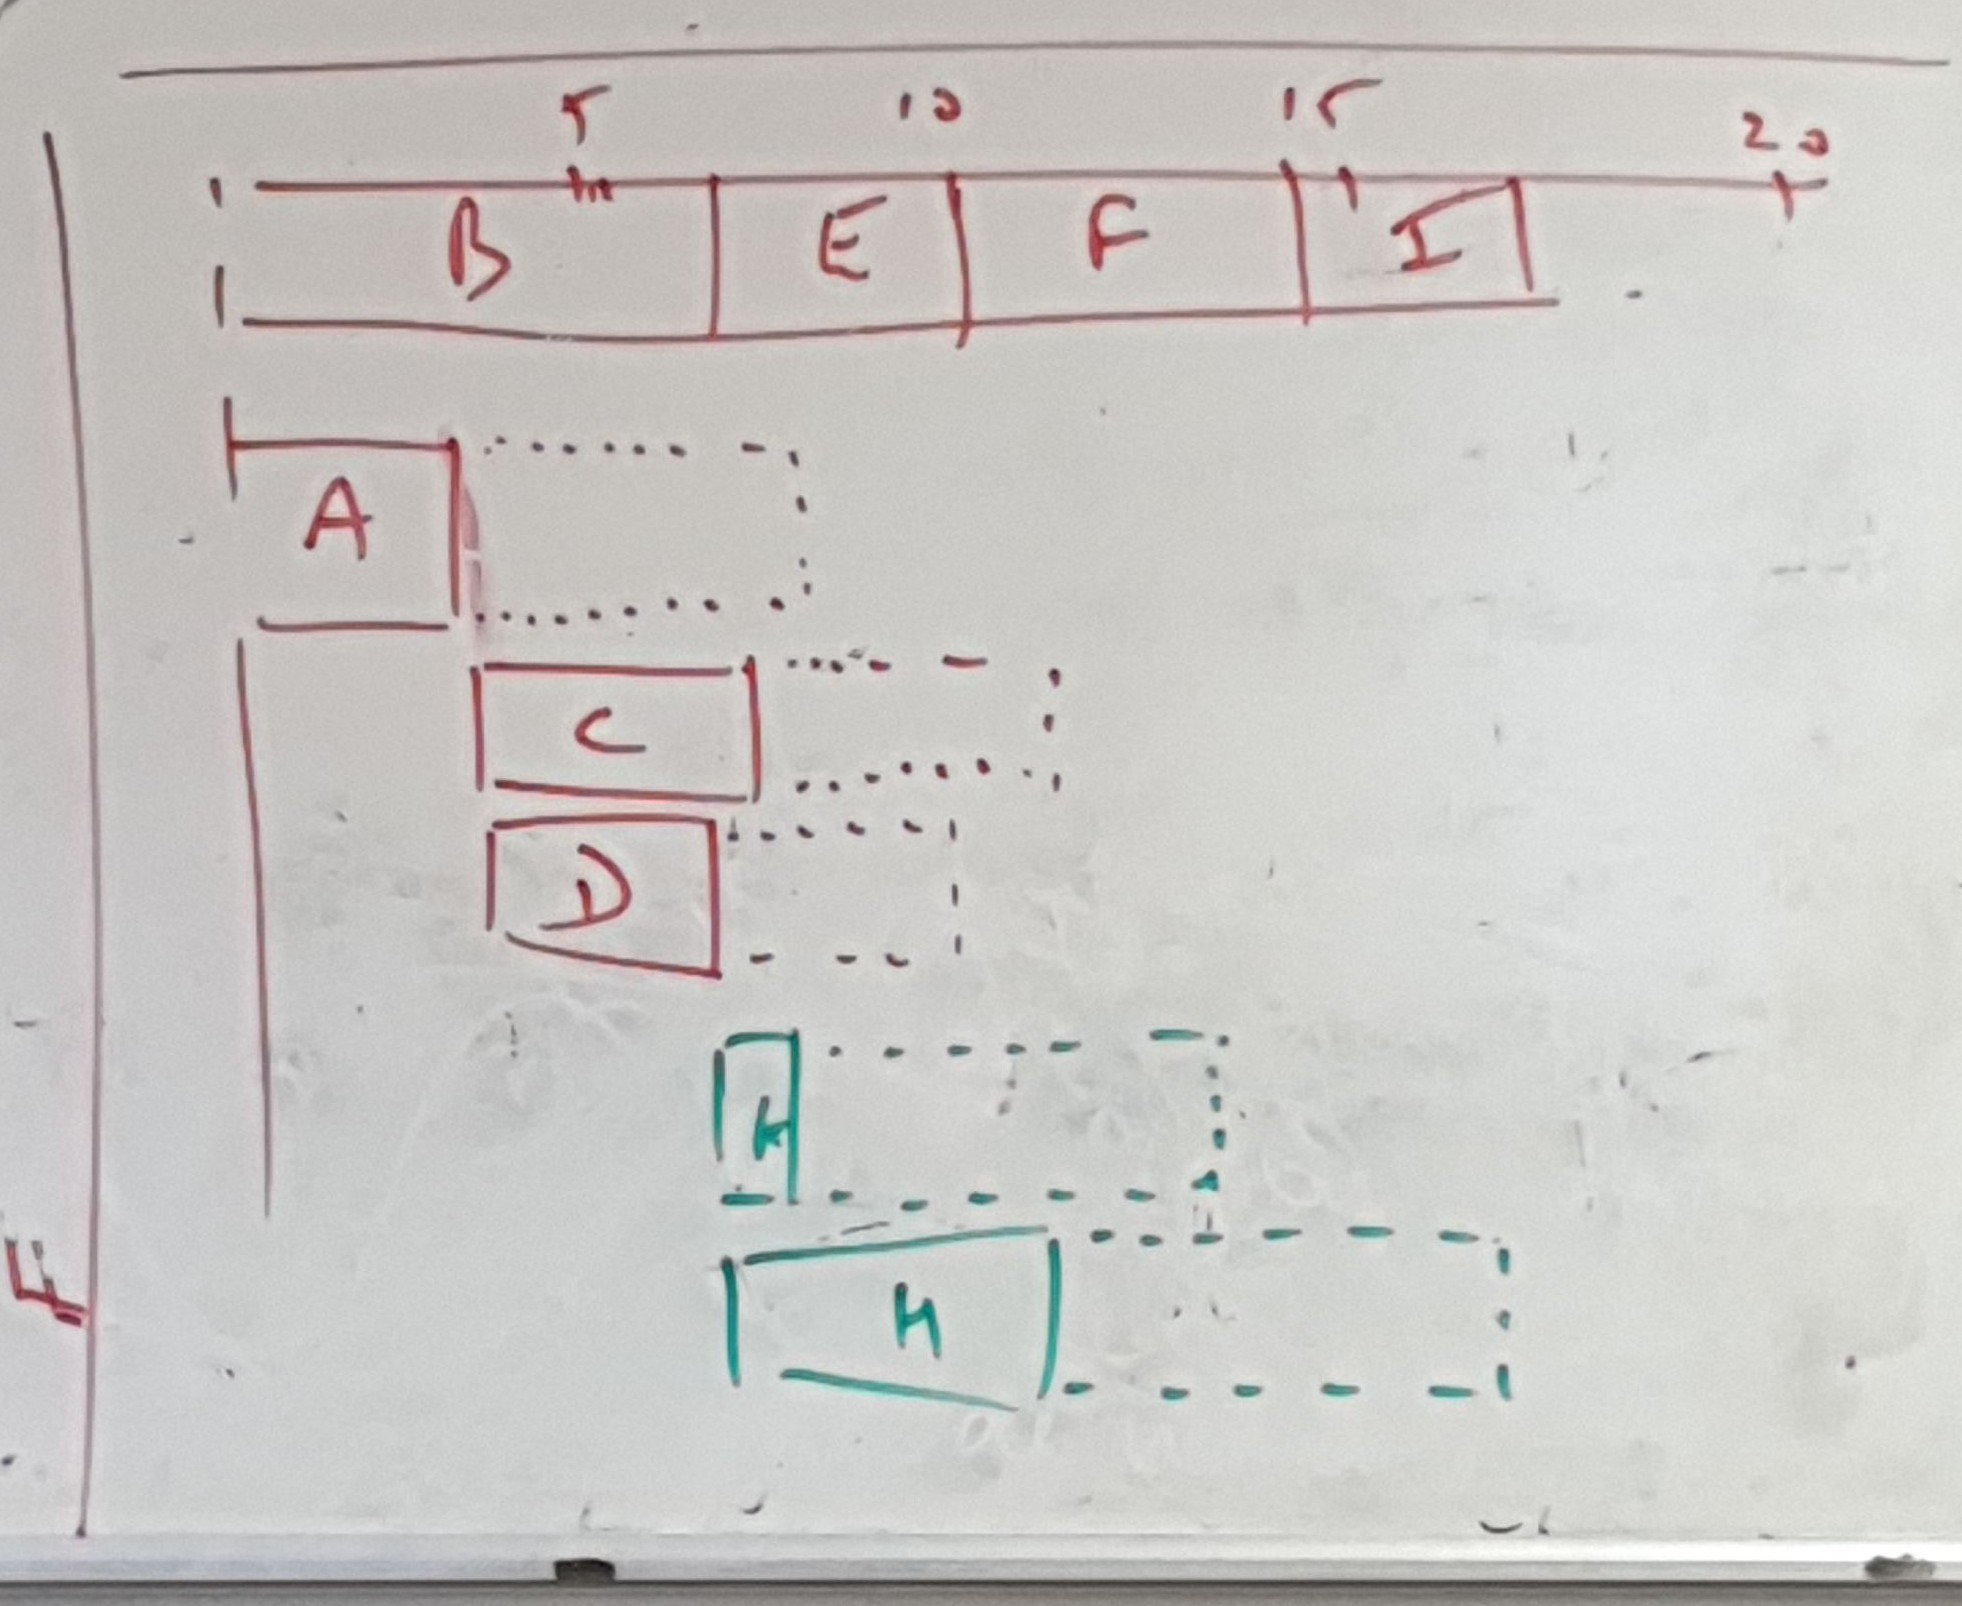
Gantt Charts
Gantt Charts
- Gantt Charts are ways to visualise activities. Critical Activities have fixed borders, whereas non-critical activities have dotted borders to visualise that the blocks can slide backwards and forwards.
Look out!
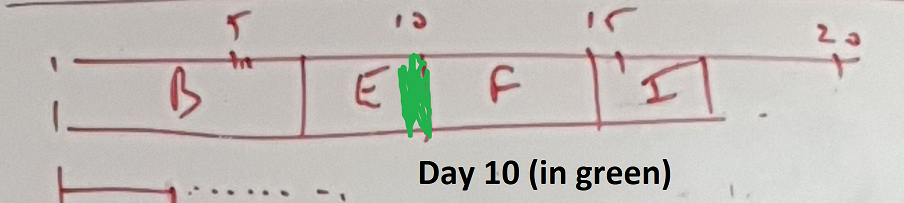
- THIS is day 10, not the part after
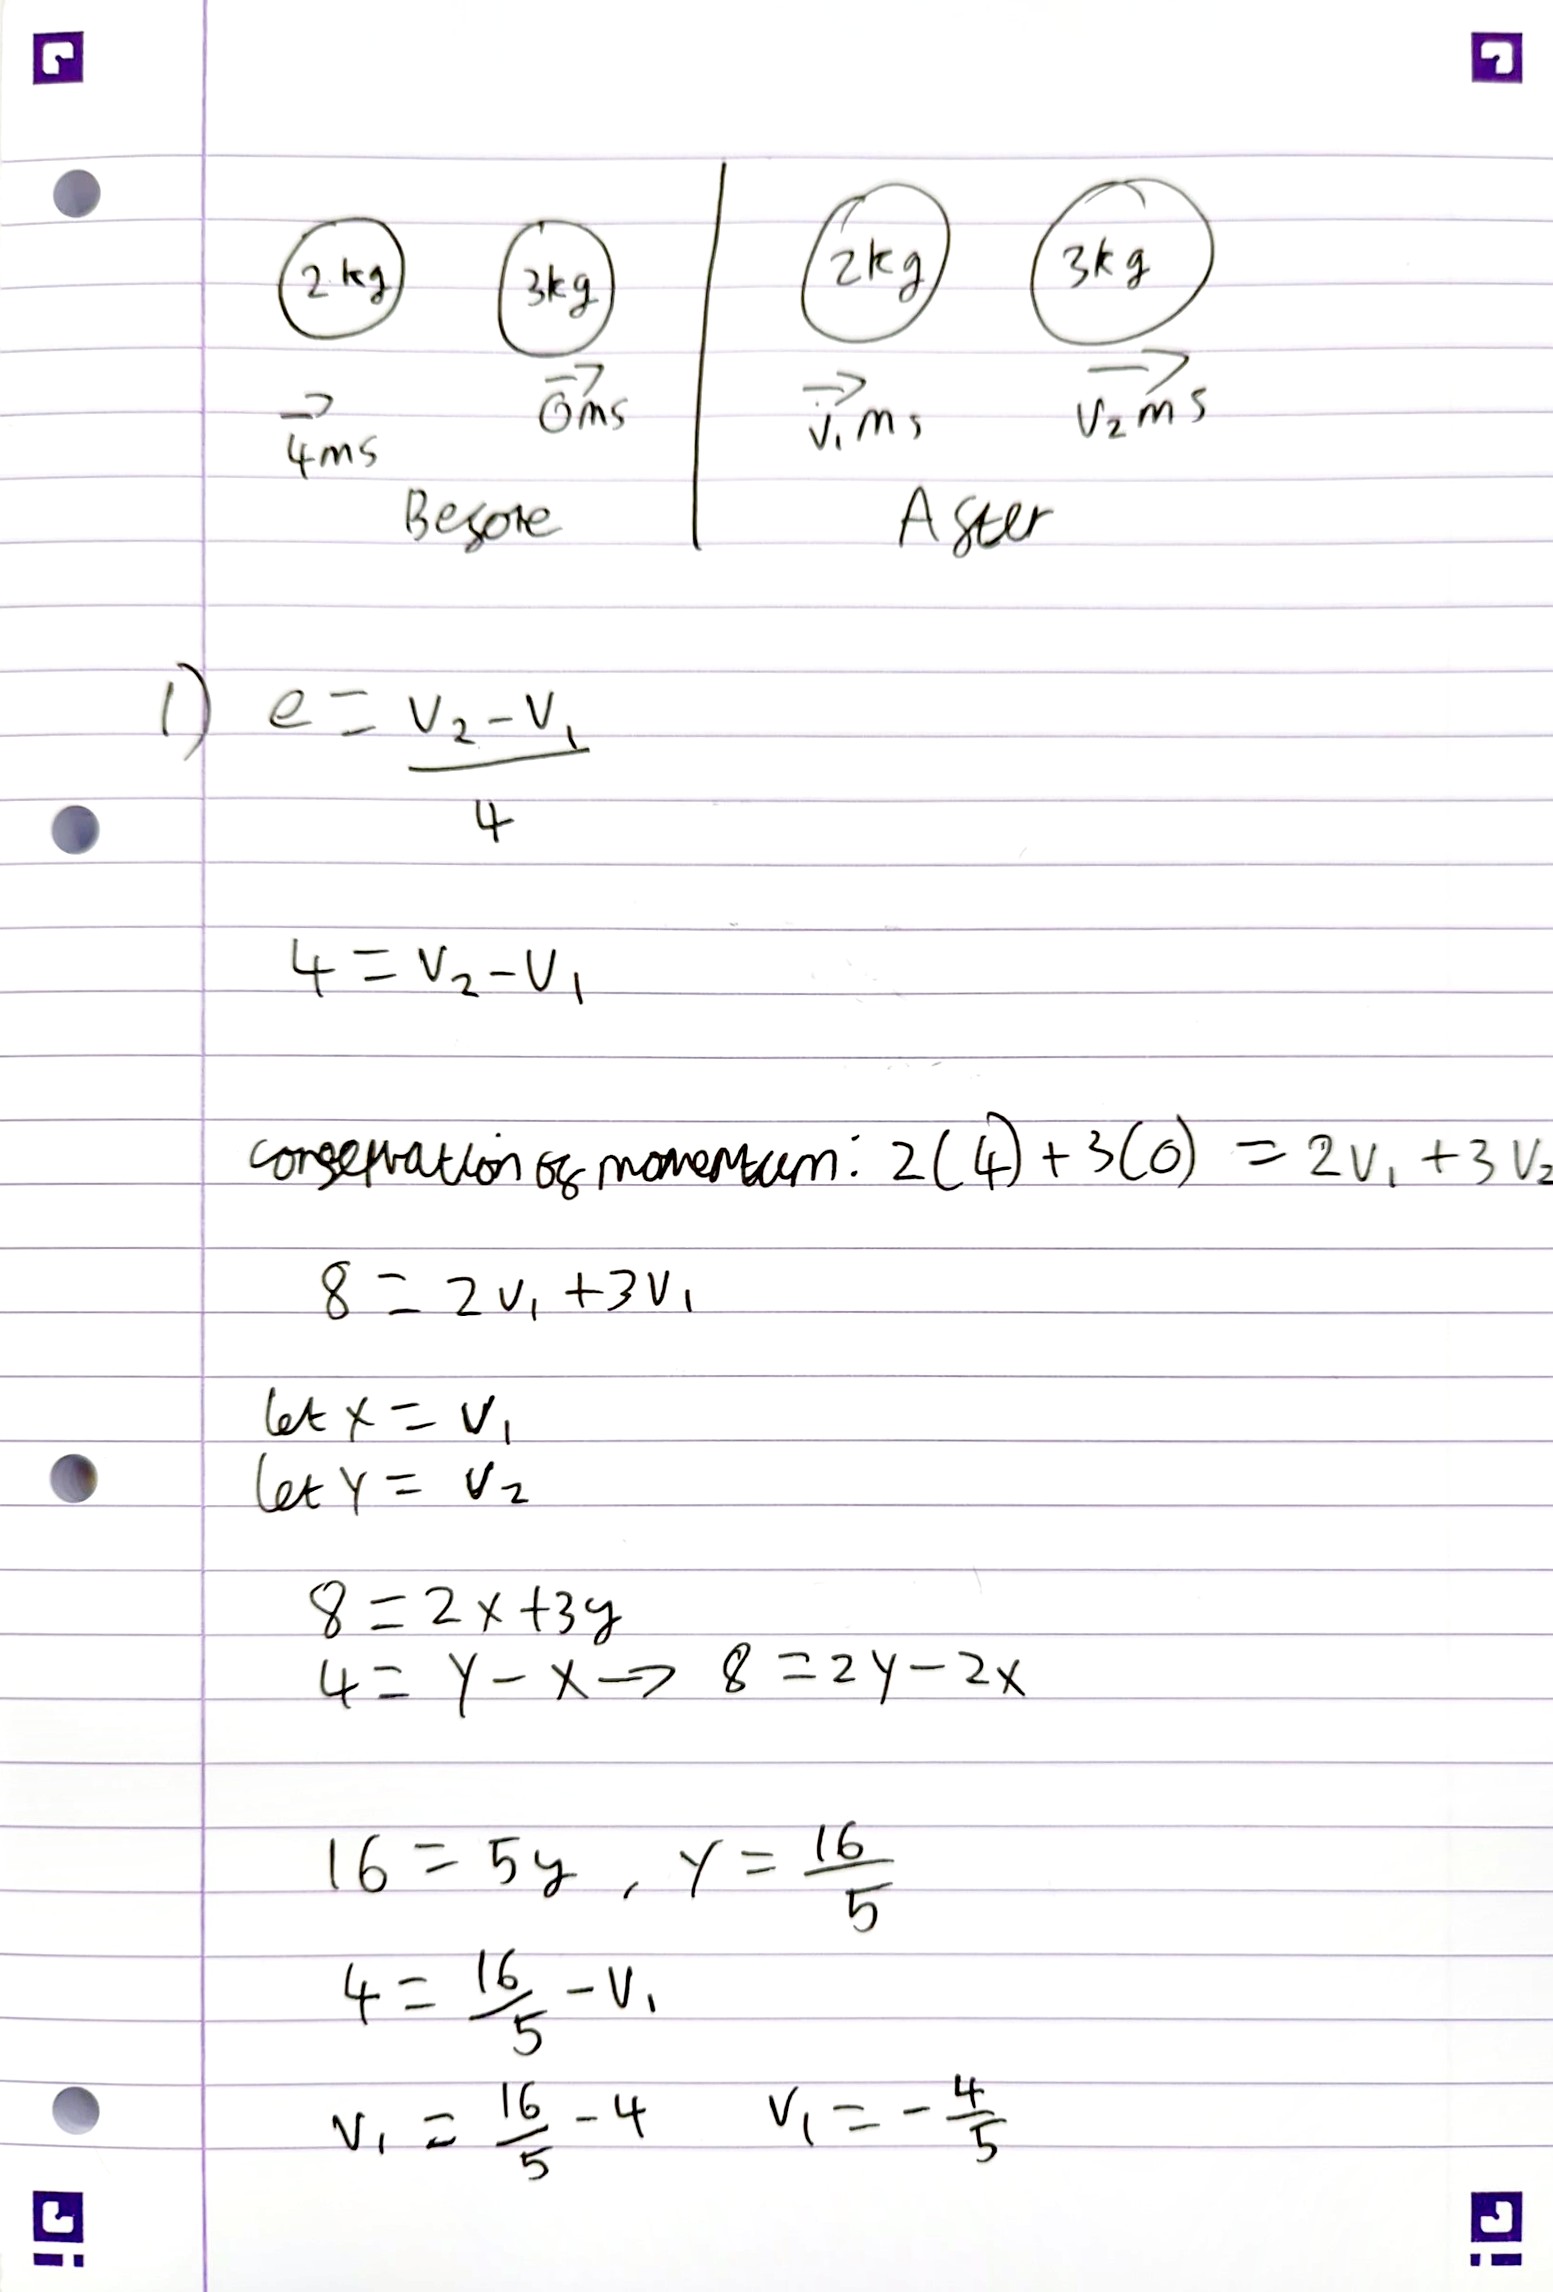
8F Q1